
INSIGHTS & MARKET UPDATES
Understand the Phoenix market with clarity, strategy, and long-term perspective.
Market trends, investor insights, financing conditions, and local analysis — designed to help buyers make informed decisions.
Data With Context
Market numbers alone don’t tell the full story.
I focus on understanding:
- pricing trends,
- inventory movement,
- financing conditions,
- neighborhood dynamics,
- and long-term opportunity.
The goal is not to predict headlines — but to help buyers and investors make clearer decisions.
Local Perspective
Different areas move differently.
Strategy Over Emotion
Avoid reactive decision-making.
Financing Matters
Rates impact behavior and affordability.
Long-Term Thinking
Focus beyond short-term headlines.
Featured Insights / Articles
From first-time buyers to long-term investors, I help clients make informed real estate decisions with clarity and strategy.
Phoenix Market Trends
Coming soon.
Interest Rates & Affordability
Coming soon.
Investor Strategies
Coming soon.
East Valley Cities Insights
Coming soon.
What I Watch in the Market
Good decisions require understanding more than price alone.
Inventory Levels
Supply impacts negotiation power and pricing pressure.
Financing Conditions
Mortgage rates influence affordability and demand.
Migration & Growth
Population and employment trends shape long-term opportunity.
East Valley Market Snapshot
East Valley Market Snapshot — September 2026
Chandler • Gilbert • Mesa • Scottsdale • Tempe
|
City |
Months of Supply |
Annual Median Sale Price |
CMI |
Annual Appreciation |
Market Trend |
|
Chandler |
2.6 |
$555,000 |
138.8 |
−0.5% |
Stabilizing |
|
Gilbert |
2.9 |
$590,000 |
110.0 |
−0.3% |
Stabilizing |
|
Mesa |
2.7 |
$490,000 |
117.5 |
−1.5% |
Stable |
|
Scottsdale |
3.5 |
$1,225,000 |
154.9 |
+3.0% |
Strengthening |
|
Tempe |
3.6 |
$540,000 |
89.1 |
+0.5% |
Softening |
Source: The Cromford Report. City snapshot data as of September 15, 2026.
CMI (Cromford Market Index): Measures the balance between supply and demand. A reading of 100 indicates a balanced market; readings above 100 favor sellers, while readings below 100 favor buyers.
Annual Appreciation: Change in annual-average sale price per square foot, calculated from annual average sale price and annual average home size.
Market Trend reflects the recent direction of market balance based primarily on changes in the Cromford Market Index (CMI).
My Take
East Valley demand remains subdued, but the gap between the five cities continues to widen.
Buyer demand remains below normal across Chandler, Gilbert, Mesa, Scottsdale and Tempe. As in August, however, similar demand conditions are producing very different market balances because supply varies substantially from city to city.
Scottsdale continues to stand apart. Its seller-side market balance remains the strongest of the five, while Tempe has weakened further below the CMI equilibrium level of 100. Chandler remains firmly seller-side, while Mesa and Gilbert continue to occupy the middle.
Price performance tells a somewhat different story. Scottsdale continues to show the strongest price resilience at approximately +3.0% annual-average $/SF appreciation. Tempe, despite having the weakest current market balance, remains modestly positive at approximately +0.5%. Mesa now shows the weakest annual price performance at approximately −1.5%, while Chandler and Gilbert remain only slightly negative.
That contrast is worth watching: current market balance and trailing price performance do not always move together. Tempe’s weaker supply-demand balance has not yet translated into declining annual-average $/SF, while Mesa’s market balance remains above equilibrium despite weaker price performance.
Foreclosure activity continues to rise from very low levels but remains historically low and is not currently a significant driver of East Valley housing conditions.
Feature City / Neighborhood Analysis
Current Featured Market: Ocotillo (Chandler)
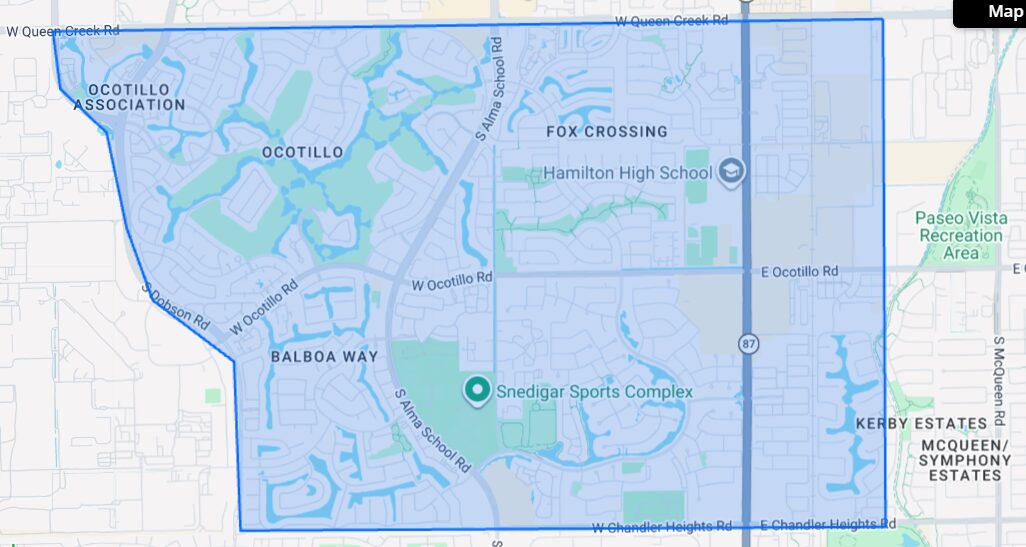
Updated Monthly
| (June 2026) | Months of Supply | Median Price | Active Listings | % of Active Listings with Price Reduction | Trend |
| Value |
What I’m Watching
Inventory has increased modestly over the past 60 days while buyer demand remains relatively stable. Homes near the golf course continue to outperform the broader neighborhood, while several properties in the $800k-$1M range have experienced multiple price reductions.
Key Opportunity
Buyers may find increased negotiating leverage in higher-priced inventory, particularly properties that have been on the market for more than 45 days.
Read Full Analysis →
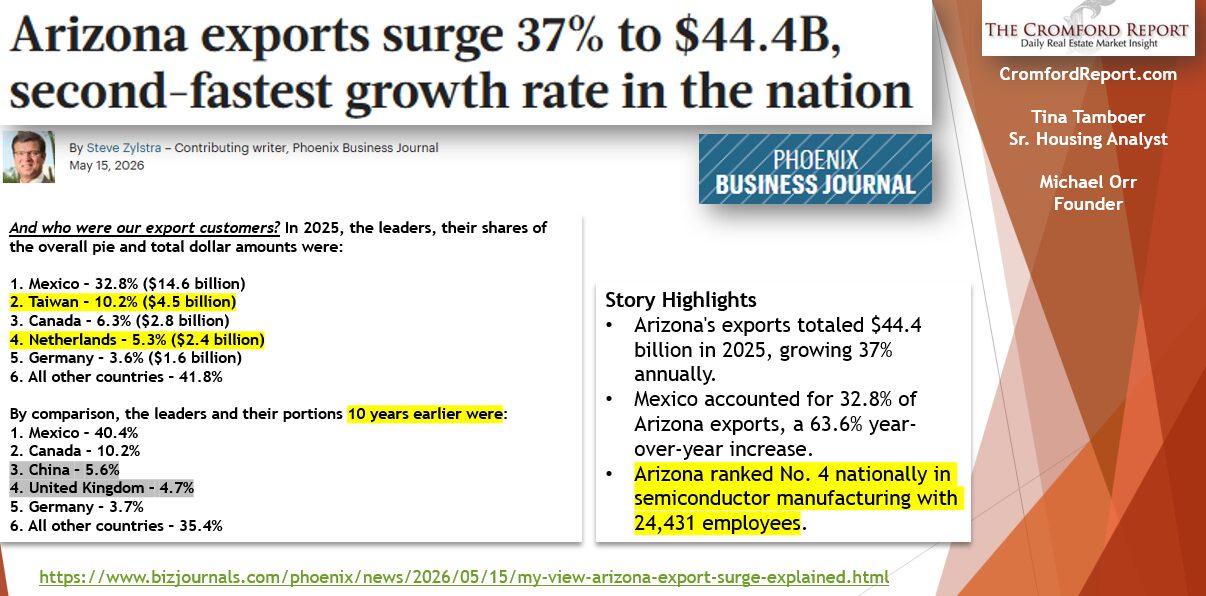
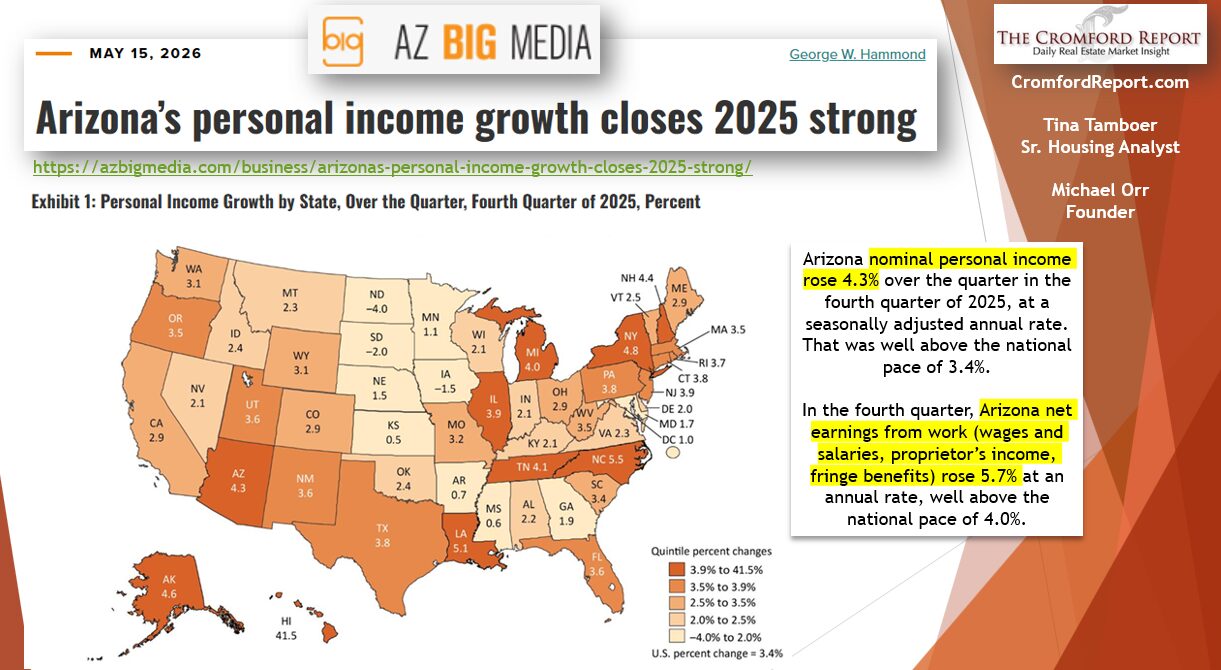
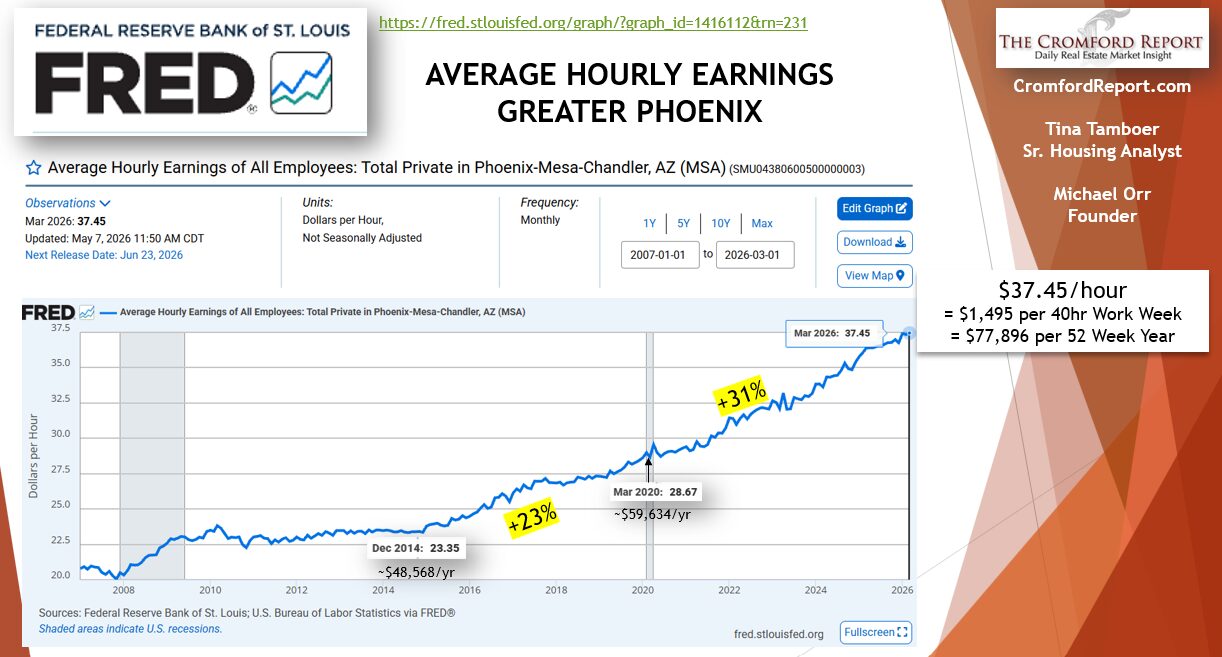
Arizona Growth & Investment Watch
Arizona Economy:
U.S. Delta Realty Market Intelligence Library
Build confidence with data—not headlines.
Explore current and historical market intelligence, original research, and neighborhood-level analysis across the East Valley.
East Valley Market Intelligence
Monthly intelligence reports covering Chandler, Gilbert, Mesa, Tempe and Scottsdale.
Research & Analysis
Original research examining real estate questions that matter to buyers, homeowners and investors.
Neighborhood & Community Intelligence
Local intelligence combining market data, research and firsthand field observations.
Let’s Talk Through the Market
Whether you’re buying, investing, or just researching the market, I can help you understand what’s happening and how it may impact your goals.